
Ride A Pet Hatch Odds Calculator: Rolls, Cost and Chance
Calculate hatch probability from your current per-roll chance, or compare the dated Dragon and Giant Egg presets with historical exact-roll costs.
FAQ
Can I use a current hatch chance in the calculator?
Are the Dragon and Giant Egg presets current?
How many rolls would a 1% Dragon take?
Is the captured Fox 30% per roll or per pack?
Does the cheapest bundle result mean the lowest spending to reach my target?
Can I enter an Index 1-in-N label as an egg chance?
Can the calculator predict my next roll?
How can I calculate the chance shown in my current game?
Choose custom probability and enter the target’s current per-roll percentage. The calculator estimates the chance of at least one success across your chosen number of rolls. That mode does not attach September Shop prices to a new offer.
The two named presets below are historical screenshot transcriptions, not live game data. Use them to understand the old cards or compare a matching offer. Check the Fox acquisition guide before assuming its appearance on a paid card means Robux is required.
Probability tool
Hatch odds calculator
Choose a dated Shop preset, or enter the per-roll percentage shown in your current client. Custom odds calculate probability only; old bundle prices are never applied to them.
Enter a percentage greater than 0 and at most 100. Use the chance of this one target, not a luck multiplier or a 1-in-N denominator.
Historical Shop screenshot: 2026-09-16. Confirm the pool and bundle prices in your current client before using its cost results.
Chance of at least one
97.2%
Fox · 10 rolls
Historical cost for exactly this many rolls
799 R
10×1
Average rolls per hatch
3.3
Rolls to reach a 50% chance: 2
| Confidence | Rolls | Historical exact-count cost |
|---|---|---|
| 50% | 2 | 198 R |
| 75% | 4 | 348 R |
| 90% | 7 | 597 R |
| 95% | 9 | 747 R |
| 99% | 13 | 1,048 R |
Assumes independent rolls and an unchanged per-roll chance, with no pity or changing bonuses. Results are probabilities, not guarantees. Preset costs minimize the price of exactly N rolls; buying extra rolls in a larger bundle can cost less. Presets are September 2026 records, not current purchase advice.
What were the captured Dragon Egg odds?
The September 16, 2026 Dragon Egg card shows named pets:
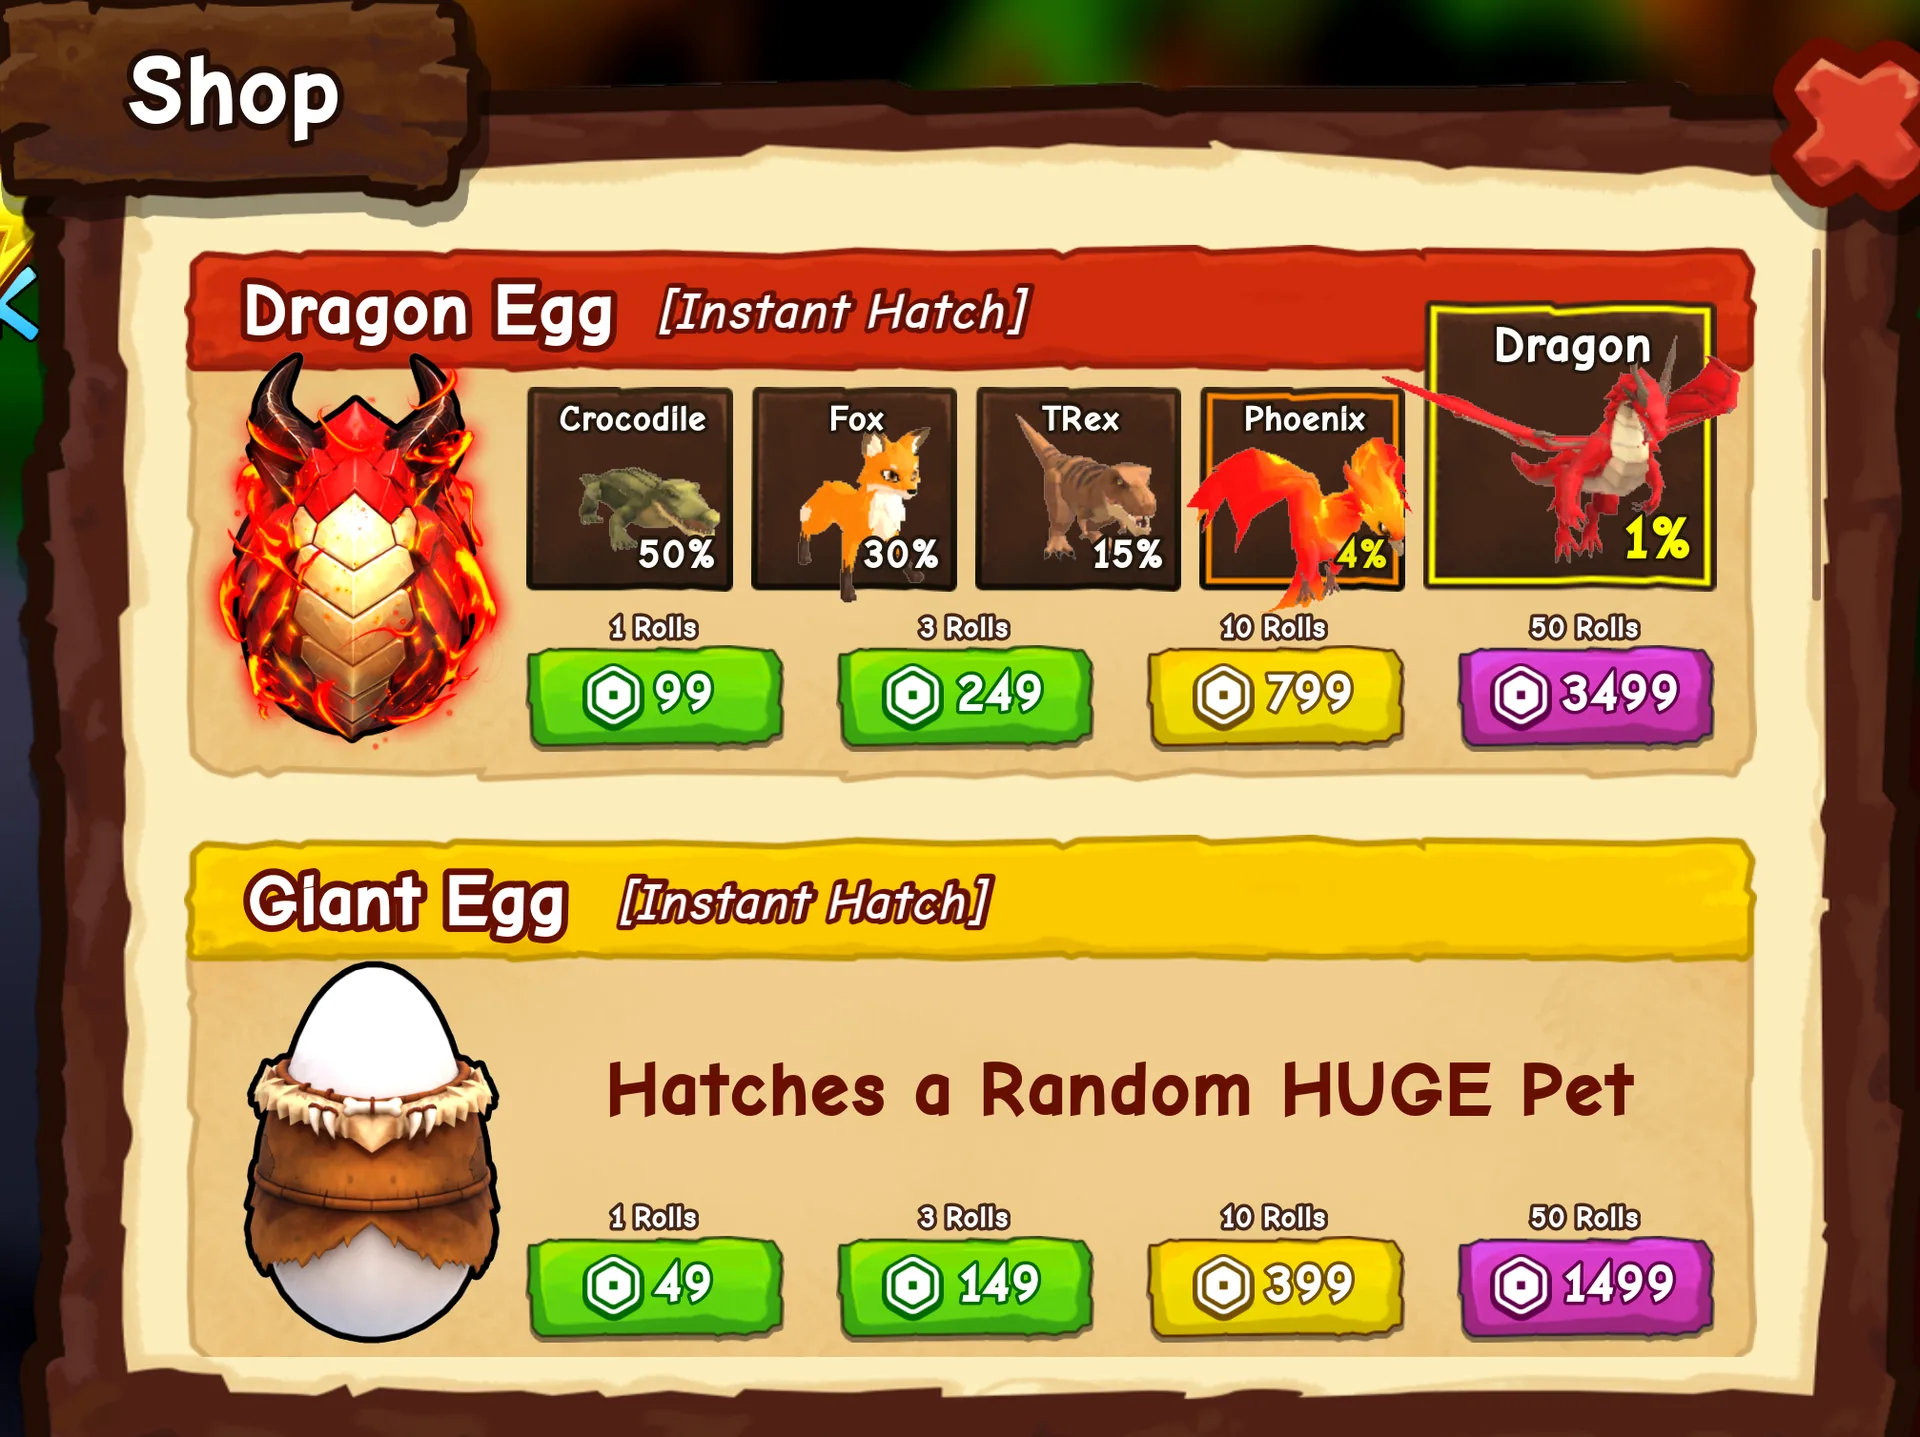
| Pet | Printed odds | Model rolls for a 90% chance | Historical minimum for exactly that many rolls |
|---|---|---|---|
| Crocodile | 50% | 4 | 348 R |
| Fox | 30% | 7 | 597 R |
| T-Rex | 15% | 15 | 1,245 R |
| Phoenix | 4% | 57 | 4,096 R |
| Dragon | 1% | 230 | 16,393 R |
The roll counts assume each attempt has the same independent probability. They do not establish the current pool or how a boost or pity rule would change it.
What were the captured Giant Egg odds?
The September 24, 2026 Giant Egg panel shows rarity bands rather than pet names:
| Tier | Printed odds | Model rolls for a 90% chance | Historical minimum for exactly that many rolls |
|---|---|---|---|
| Common | 40% | 5 | 245 R |
| Rare | 30% | 7 | 343 R |
| Epic | 20% | 11 | 448 R |
| Legendary | 5% | 45 | 1,841 R |
| Mythic | 4% | 57 | 1,842 R |
| Divine | 1% | 230 | 7,193 R |
| Ethereal | 0.1% | 2,302 | 69,052 R |
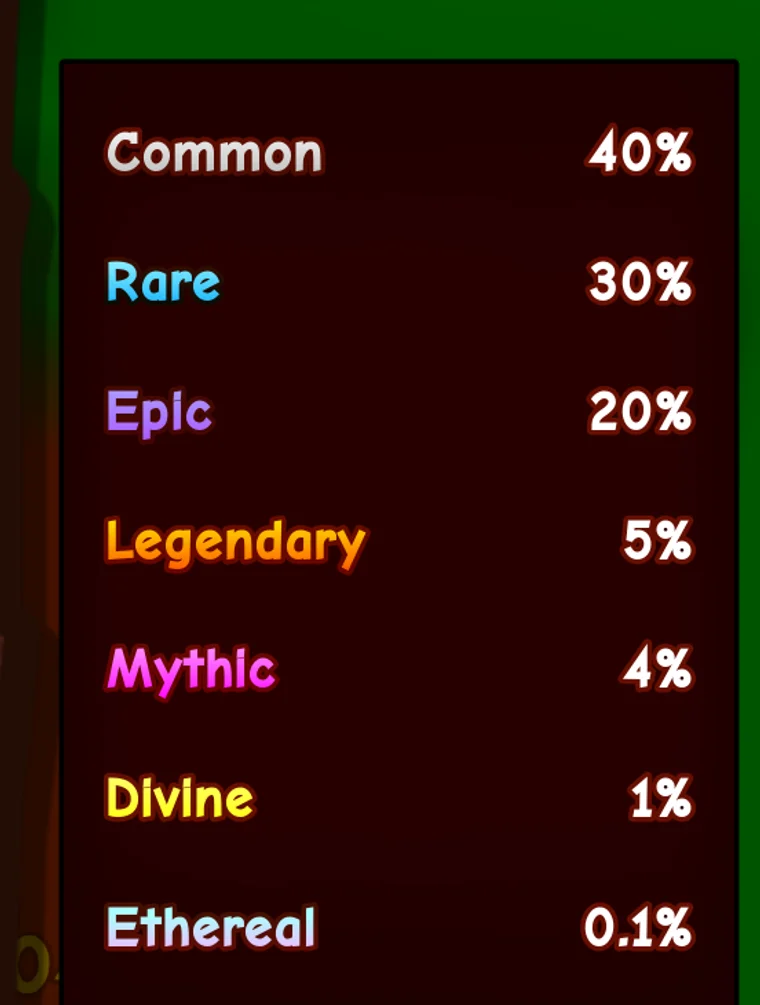
The printed bands total 100.1%. They are displayed values with rounding, so the model’s precision is limited by its inputs. This page preserves the individual printed rates; it does not invent a normalized distribution or identify the HUGE pet behind each band.
The cost column means exactly N rolls. With the captured Giant offers, exactly 45 rolls cost at least 1841 R, while one 50-pack cost 1499 R. The extra-roll purchase is cheaper in that example. A minimum for an exact count is not the same question as the lowest spending to buy at least that many rolls. Read the full historical Shop tables before comparing bundles.
How is each result calculated?
For a fixed per-roll success probability p and N independent rolls:
- At least one success: 1 − (1 − p)ᴺ.
- Rolls for confidence c: round ln(1 − c) ÷ ln(1 − p) upward to the next whole roll, for probabilities strictly between zero and one.
- Average wait: 1 ÷ p. At 30% this is about 3.3 rolls; at 1% it is 100.
- Median wait: the first whole roll count at which success probability reaches 50%. The same examples give 2 and 69 rolls.
- Historical exact-count cost: choose the least expensive combination of the captured bundles totaling exactly N rolls.
For example, at the old 1% Dragon rate, 230 rolls give about a 90.1% chance of at least one Dragon. Four old fifty-packs and three ten-packs total exactly 230 rolls for 16,393 R. That is a historical arithmetic example, not a current offer, a spending recommendation or a guaranteed Dragon price.
What should I do if the result differs from the game?
Check the selected outcome and rate first. A 1% rarity band is not a named pet’s probability if that band contains several pets. An Index 1-in-N label is not automatically the probability inside the egg you are opening.
If a current card mentions guarantees, pity, changing boosts or dependent outcomes, this constant independent-roll model may not apply. Use the game’s stated rule instead; the calculator does not verify those mechanics. A failed run also does not, by itself, prove that the printed rate changed.
What can the numbers tell me before I spend?
A probability describes uncertainty, not how much money secures a pet. At a fixed rate below 100%, any finite run can fail in this model. Buying a larger pack changes the number of attempts and total cost; it does not make the target certain.
Use your own budget separately from the mathematical average. If current prices or rates differ, use custom probability for the chance calculation and compare the actual confirmation prices yourself. The official experience listing identifies the game but does not supply live hatch odds.
Related Articles
pets
Ride A Pet Fox: Glass Egg Route and Dragon Egg Odds
Check the reported free Glass Egg route for Fox, compare the dated 30% Dragon Egg card, and avoid treating old odds as a guaranteed purchase.
pets
How to Get the Dragon in Ride A Pet: Odds and Cost
Read the dated Dragon Egg card, understand its 1% probability and 999 MPH promo, and check the current pool before spending Robux.
guides
Ride A Pet Shop: Dated Egg Odds, Prices and Pass Status
Compare the saved Dragon and Giant Egg cards, read historical bundle prices, and check the officially listed game-pass sale status.
Was this helpful?
Thanks for the feedback!